 |
| Business Analysis Techniques - Context Diagram |
There are many techniques that can be used in Business Analysis.
One part of this toolset is modelling techniques - diagrams with supporting text, often used to model business processes and business data.
Process modelling helps us to understand how a business system works now (as is) and possible areas for improvement.
This helps to identify requirements for a new system, analyse those requirements and produce models showing how a new improved system might work.
There are many process modelling techniques that might be used to achieve this.
This post focuses one of the simplest - Context Diagrams.
This is the second post on this topic and follows on from a previous post - take a look at that here:
Process Modelling - Context Diagrams - Part One
Context Diagrams Part One covers the "What", "When" and "Why" - this post will focus on the "How".
First - Notation - the symbols that can be used on the diagram to convey a particular meaning.
The idea is to use a standard notation so that everybody can understand what a particular diagram is showing in business terms. There are various standards out there. It doesn't matter, in principle, which standard you use as long as everybody involved in the project understands it. Here I''ll be using a notation widely used in the UK.
To illustrate this, here I'll show the steps involved in building a Context Diagram for a Hotel Booking and Administration System.
The System under analysis is represented as a single box.
The box represents the system boundary.
Inside the box is a name representing the system as a whole.
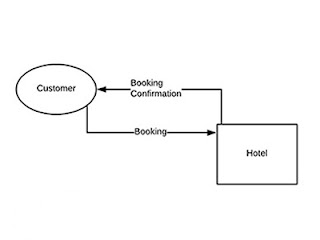
So here we can start the diagram with a simple rectangular box labelled "Hotel".
Things outside the system boundary that interact with it are called External Entities.
These are represented with an ellipse labelled with a name. For example - one of the External Entities for a Hotel might be a Customer – somebody who stays or visits and spends money on services.
Interactions between External Entities and the system are shown as Data Flows.
Represented by lines with an arrowhead showing the direction of the flow and text briefly describing what it is. For example one of the interactions between a Customer and the Hotel might be a booking.
Things outside the system boundary that interact with it are called External Entities.
For the purposes of the Context Diagram – we are only interested in how these interact with the system.
In this case - for example a customer makes a booking.
We are not interested, at this stage, in when they make a booking or how they decide to make a booking. This can be analysed later as needed.
We are simply modelling the data flow into the system – Booking – and the flow back to them – Booking Confirmation.
One advantage of Context Diagrams is that they are relatively straightforward and easy to understand.
This makes validation with business users and other stakeholders easier.
They can then form a basis for more detailed analysis as needed, using other techniques such as Use Case Diagrams or Data Flow Diagrams.
Context Diagram - Summary.
A High Level Diagram.
Shows:
You might also find these blog posts useful:
Process Modelling - Context Diagrams - Part One
Stakeholder Analysis
You could also take a look at my online courses that cover various Business Analysis techniques in more detail:
Getting Started In Business Analysis
Business Analysis Techniques - Stakeholder Analysis
This makes validation with business users and other stakeholders easier.
They can then form a basis for more detailed analysis as needed, using other techniques such as Use Case Diagrams or Data Flow Diagrams.
Context Diagram - Summary.
A High Level Diagram.
Shows:
- System Boundary.
- External Entities.
- Data Flows – into system.
- Data Flows – out of system.
You might also find these blog posts useful:
Process Modelling - Context Diagrams - Part One
Stakeholder Analysis
You could also take a look at my online courses that cover various Business Analysis techniques in more detail:
Getting Started In Business Analysis
Business Analysis Techniques - Stakeholder Analysis


