 |
| Business Analysis Techniques - Process Modelling |
There are many techniques that can be used in Business Analysis.
One part of this toolset is modelling techniques - diagrams with supporting text, often used to model business processes and business data.
Process modelling helps us to understand how a business system works now (as is) and possible areas for improvement.
This helps to identify requirements for a new system, analyse those requirements and produce models showing how a new improved system might work.
There are many process modelling techniques that might be used to achieve this.
This post focuses one of the simplest - Context Diagrams.
Context Diagram – What it is:
- A diagram showing flows of information into and out of a business system.
- Defines a boundary between the system and its environment, showing the entities that interact with it and how they interact.
- Provides a top level view of things and so is a useful starting point for further process analysis.
 |
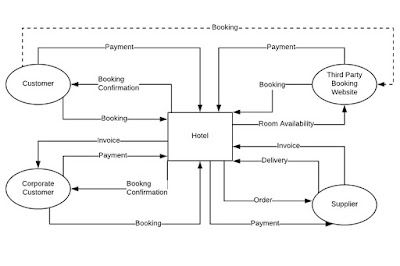
| Context Diagram - Hotel Booking and Administration System |
To start - the box in the centre of the diagram represents the system that we are investigating and analysing - in this case - "Hotel".
The ellipse shapes around the outside represent External Entities, sometimes called "Actors" (particularly in UML - Unified Modelling Language). Essentially - anybody or anything that interacts with the system. In this example - one of these is "Customer".
The arrows show interactions between the External Entities and the system, flows of data, with the arrowheads indicating the direction of the flow.
 |
| Context Diagram - Hotel Booking and Administration System |
Hotel - System.
Customer - External Entity (or Actor).
Booking - Data Flow.
Booking Confirmation - Data Flow.
The content of these data flows, what triggers them, how frequent they are, any business rules that apply - and so on - can be analysed in more detail later for on. A Context Diagram just aims to show a top-level view of a system.
So to summarise:
Context Diagram – What it is:
- Defines a boundary between the system and its environment, showing the entities that interact with it. .… those interactions are shown as data flows.
- Provides a top level view of things and so is a useful starting point for further process analysis.…. the box in the centre – representing the system can be broken down further later on.
Context Diagram – When it might be used:
- Could be used at any time.
- Often used early in a project to understand the current system.
- Can be used later as part of a specification for a new system..
Context Diagram – Why it is useful:
- Helps to understand more about a business system and how it works.
- Helps to define the boundary of the system under investigation – scope.
- Can be validated with business users and other stakeholders relatively easily.
- Helps to understand requirements for a new system.
So that covers three of the classic questions - What, When and Why.
The Who and the How will be covered in future posts.
If you have any questions - please comment below or get in touch.
No comments:
Post a Comment